


Plot On app for iPhone and iPad
Developer: Gunnar Bjelland
First release : 21 May 2013
App size: 3.18 Mb
Plot On lets you create your own trend graphs for everyday figures like expenses, savings, weight, domestic energy consumption, car mileage, reading for exams, or running/bicycling pace.
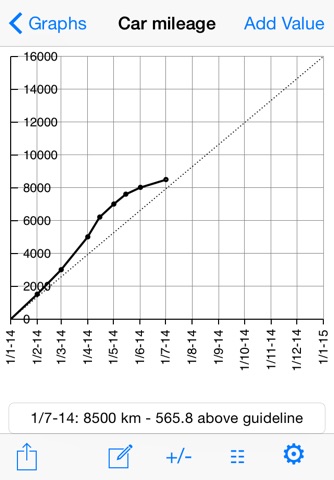
A Plot On graph visualizes how a certain value changes during a period of time. The X-axis represents time, while the Y-axis represents the value.
You create an empty graph for a certain period of time, with expected start value and end value. As you later add real values to the graph, Plot On displays a curve visualizing the real progression compared to the guideline given by the expected endpoints.
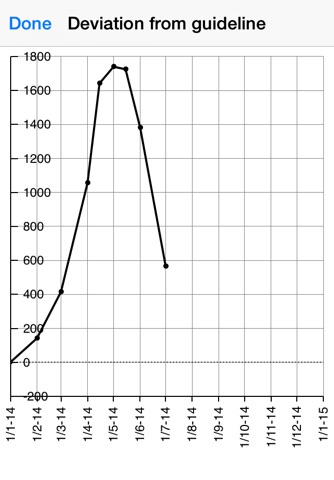
By comparing your graph with the guideline, you can easily see whether you are approaching your goal or not.
When adding a value to your graph, Plot On tells you exactly how much this value differs from the guideline - whether it is above or below, or if it´s a "spot-on".